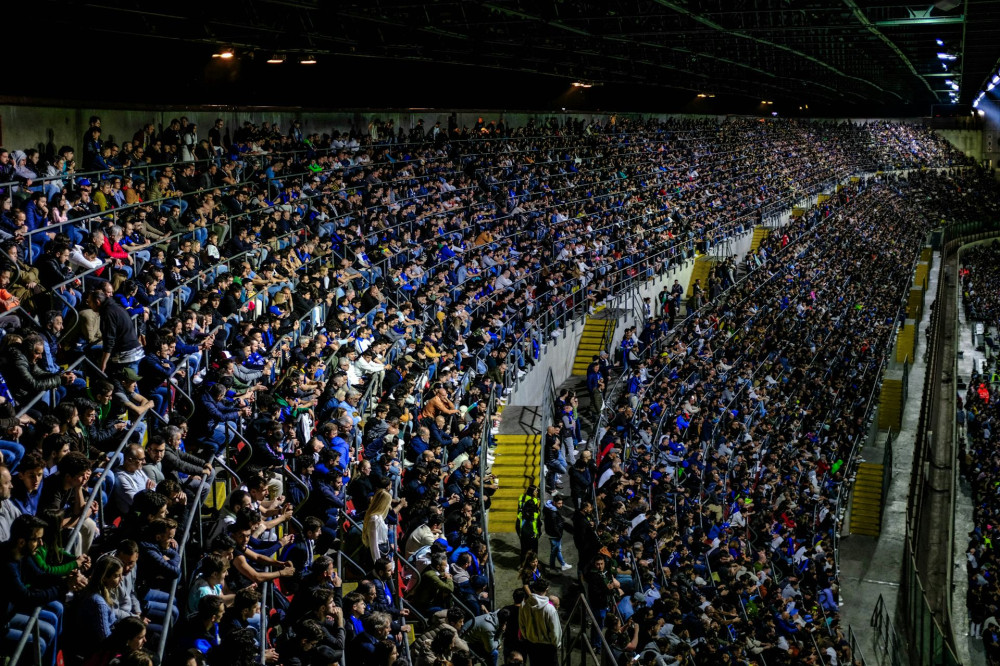
Pace and Shooting Stats: What the Numbers Reveal About the Game

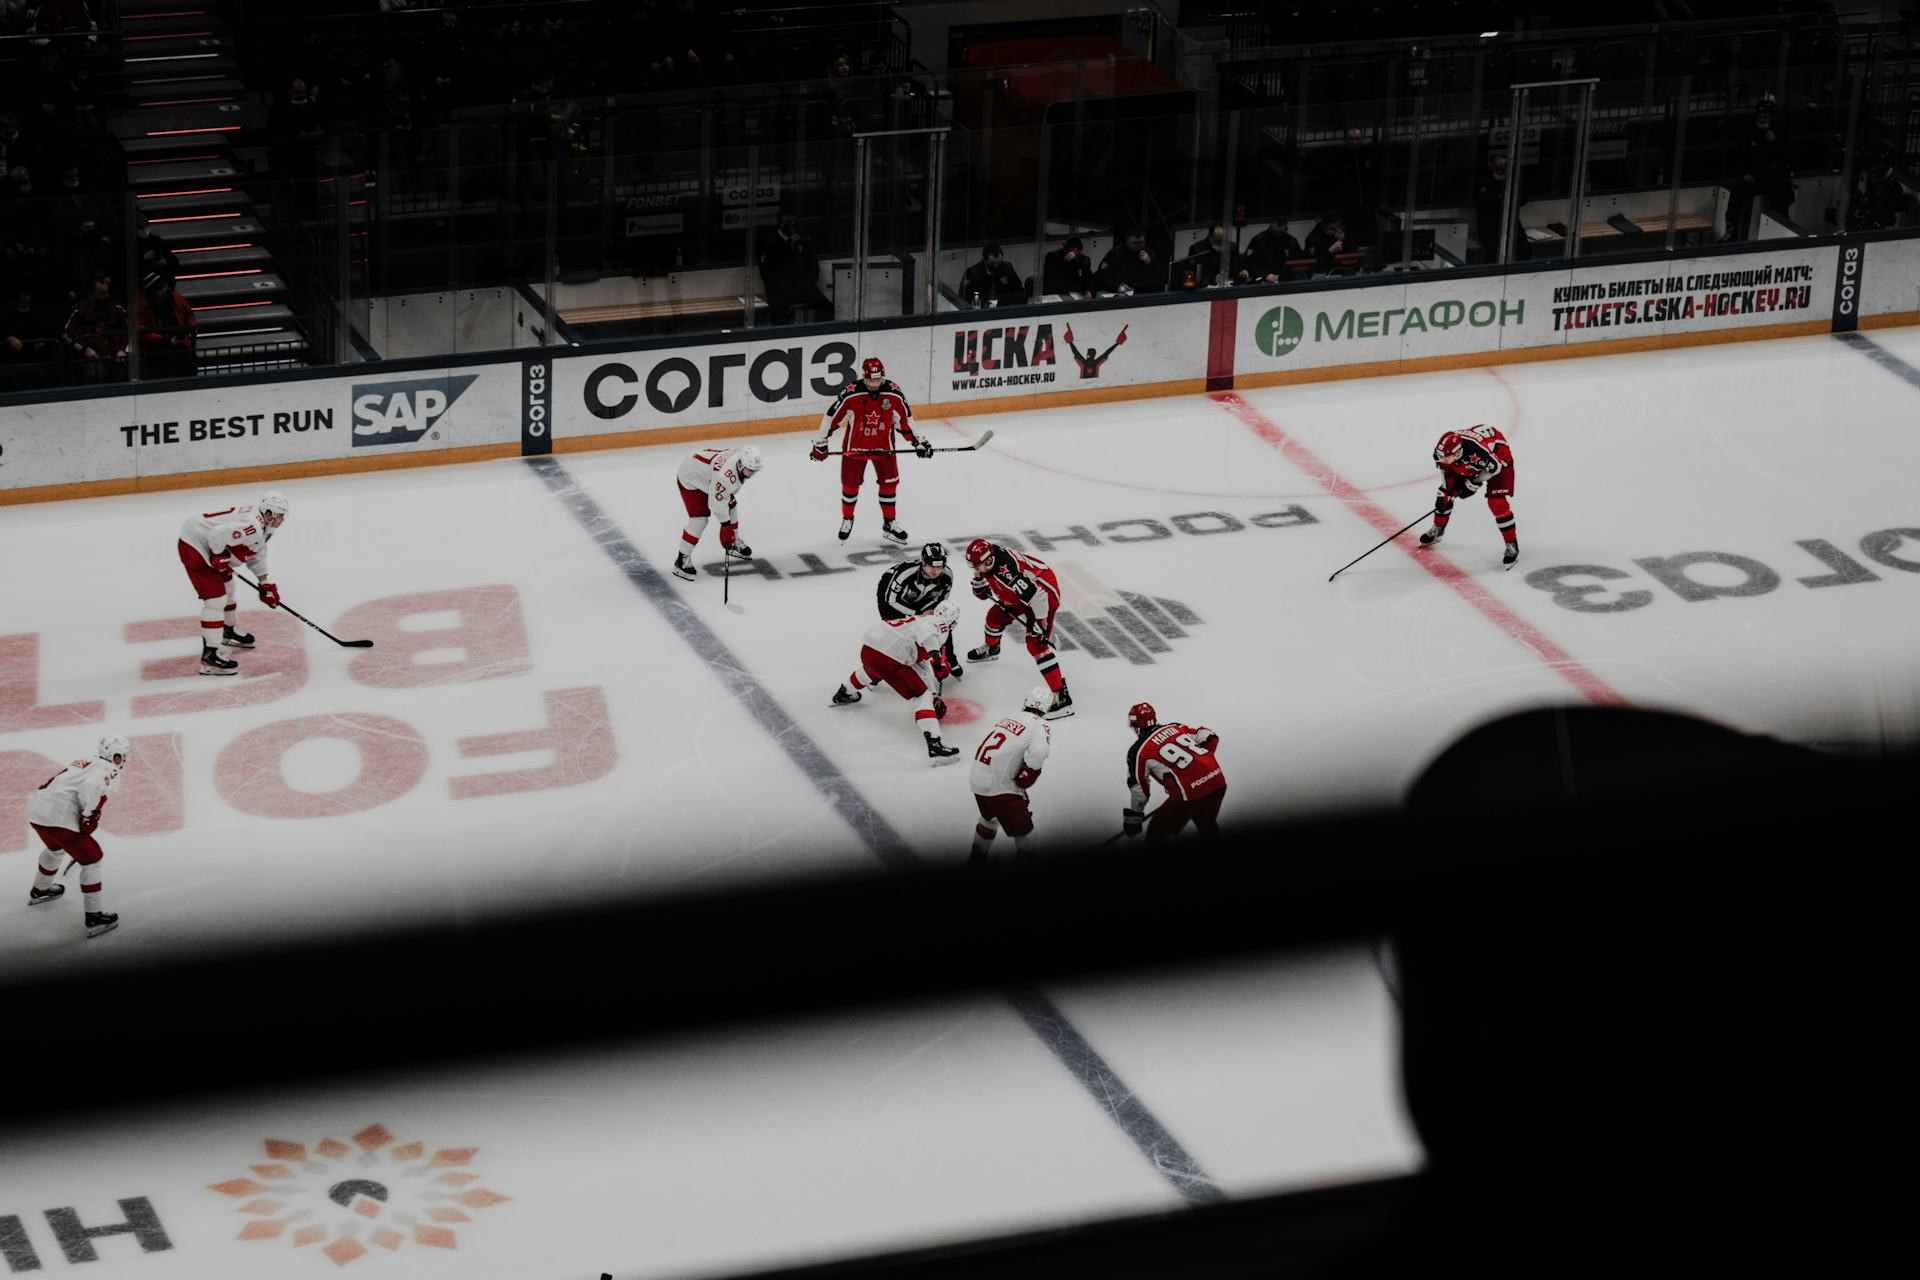
Pace and Shooting Stats: What the Numbers Reveal About the Game
When the final buzzer sounds and the scoreboard locks in the result, it’s tempting to think the story ends there. But behind every goal lies a wealth of data that paints a far more detailed picture. Pace, shooting stats, and efficiency are among the key metrics that help explain why one team came out on top—and why the other didn’t.
Shooting Stats – More Than Just Shot Totals
Shots on goal are one of the most quoted numbers in any game summary. But it’s not just about quantity—it’s about quality. A team might fire 40 shots and still lose, while the opponent scores three times on just 20 attempts. The difference often comes down to shot location, traffic in front of the goalie, and timing.
Analysts often turn to expected goals (xG), a metric that estimates the likelihood of a shot becoming a goal based on where and how it’s taken. A team with a high shot count but low xG may have struggled to create dangerous chances—a sign that the opposing defense kept them to the perimeter.
Læs også:
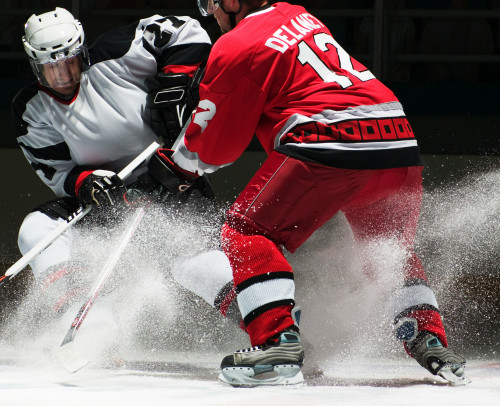

Pace – The Pulse of the Game
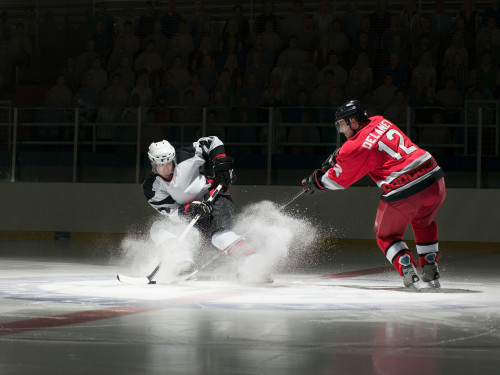
Pace in hockey can be measured in several ways: how quickly the puck moves, how often lines are changed, and how many transitions occur between zones. A fast pace can force turnovers and defensive breakdowns, but it also demands stamina and structure.
Teams that maintain a consistent high pace often gain an edge late in games, when fatigue sets in. Metrics like puck possession, zone entries, and skating distance can reveal which team truly controlled play—even if the scoreboard doesn’t show it.
Efficiency – The Hidden Difference
Another crucial number is shooting efficiency: the percentage of shots that actually find the back of the net. A team with low efficiency might dominate possession and chances but fail to capitalize, while a more clinical team makes the most of limited opportunities. Efficiency often reflects composure, experience, and the ability to execute under pressure—especially on the power play.
Goaltending plays a huge role here as well. A hot goalie can neutralize an opponent’s high pace or shot volume, while an off night in net can undo even the best offensive performance.
When the Numbers Come Together
The most revealing insights come when these stats are viewed together. A team with high pace, lots of shots, but low efficiency might be playing an aggressive yet wasteful style. Conversely, a team with fewer shots but higher efficiency and strong defensive metrics could be executing a disciplined, tactical game plan.
By combining data on pace, shooting, and efficiency, analysts can build a more complete picture of how a game unfolded—and even predict how teams might perform in upcoming matchups.
Stats as a Tool – Not the Whole Story
While numbers can explain a lot, they never tell the entire story. Hockey is a game of momentum, emotion, and split-second decisions. A single penalty, a post hit, or a clutch save can swing the outcome. Statistics highlight trends, but they can’t capture the unpredictable.
For coaches, players, and fans, though, these numbers are invaluable. They show where a team excels and where adjustments are needed. Ultimately, it’s the blend of data and intuition—the marriage of analytics and on-ice feel—that makes modern hockey analysis so compelling.
Læs også: